Payback Period Modeling for Robotic Automation Beyond Labor Savings
Complete ROI models capture quality, throughput, and uptime gains alongside labor savings.

A proposal lands on the board's desk with one number on it: the cost of the robot, divided by the salary of the worker it replaces. The board sends it back because the arithmetic behind it is too thin to trust. Oxmaint's 2026 investment analysis names this as the most common mistake in the field: using robot cost divided by displaced worker salary underestimates labor costs on its own terms and leaves out quality, safety, and throughput gains entirely. iFactory's 2026 manufacturing ROI guide says the same thing from a different angle: most ROI proposals fail board scrutiny because they count only labor savings, and the formula that actually holds up captures four distinct value drivers, not one.
The instinct to anchor on labor is easy to understand. It's the easiest line to quantify, the easiest to defend in a meeting, and the easiest to pull from a payroll system without any new measurement work. But that convenience is why the model is incomplete: labor typically accounts for only something like a third to half of total annual savings once quality, throughput, and uptime are added in. A model that stops at labor is throwing away the majority of the case before the board even sees it.
The cost of getting this wrong runs in both directions. A proposal that undercounts benefits either fails the board's payback threshold outright, or it passes with a number that turns out wrong once the project is running, which damages the credibility of every automation proposal that follows it. Companies that build complete models consistently see payback periods of 18 to 30 months. Companies that model labor only tend to do worse: they either overestimate the timeline and lose a project that should have cleared the bar, or they miss the real payback window entirely and get caught flat-footed when the board asks why the number moved.
Total Installed Cost
The benefit side of the equation gets most of the attention, but the cost side fails just as often, and it fails earlier. The robot arm's price tag is not the project's cost, and treating it as such inflates the apparent return before a single dollar of savings has even entered the calculation.
Oxmaint's 2026 analysis is blunt about where the real number hides: integration, training, floor modifications, and ongoing maintenance add real weight to the sticker price, and the gap between the quoted automation cost and the actual total cost of ownership is where most ROI projections fail. Integration engineering is the line item that gets underestimated most consistently. Experienced integrators bill at substantial hourly rates and need hundreds of hours to design the cell, write the code, and commission it on the floor.
The denominator has a second component that gets skipped just as often: the annual operating cost that follows the install. Maintenance alone runs a meaningful percentage of hardware cost every year, and energy, software licenses, and spare parts add further operating expense on top of that. None of this is optional in the math. iFactory's 2026 framework states the formula: Payback Period equals Total Installed Cost divided by Annual Net Benefit, where Annual Net Benefit equals Labor Savings plus Throughput Gains plus Quality Savings plus Downtime Recovered, minus Annual Operating Costs.
Once the cost side of that equation is honest, the four terms on the benefit side carry the weight of the whole argument. Getting the denominator right only matters if the numerator is equally rigorous, and that numerator has four parts, not one.
Driver one: fully-burdened labor savings, calculated correctly
Labor is the right place to start, and it should stay in the model. Fully burdened labor cost is base wage multiplied by a substantial additional share, with BLS ECEC data putting the multiplier for U.S. production workers toward the higher end, once payroll taxes, benefits, workers' compensation, and overhead are folded in. That multiplier means a labor-savings number either holds up under a CFO's questioning or collapses the moment someone asks whether it includes benefits. iFactory's 2026 guide cites U.S. fully loaded labor at $50–$70 per hour, making the annual figure for a single FTE on a single shift large enough to anchor a defensible case before any other driver is added.
That's a meaningful foundation. It is not the whole structure.
The biggest lever inside the labor driver is shift count, not the wage rate. Once the integration cost is sunk, every additional shift the cell runs is close to pure acceleration of the return, because the capital cost doesn't change while the labor offset multiplies. Dynamic Group, a manufacturer in Ramsey, illustrates the mechanism concretely: three UR10 cobots deployed for injection molding machine tending and kitting let the plant move from three operators on one shift to three shifts a day with one operator per shift, quadrupling production capacity and reaching ROI in two months.
Labor savings deserve full weight in the model, calculated on fully burdened cost and multiplied across every shift the cell actually runs, with overtime elimination, reduced recruiting and onboarding cost, and lighter supervisory overhead counted in alongside the base wage offset. Oxmaint's investment guide frames labor as typically the dominant share of total automation savings, the largest single driver, but still not the whole model. Regional wage variation matters here too: lower loaded labor rates in warehouse logistics or similar markets produce a meaningfully longer payback timeline on identical hardware, so the labor line has to be calibrated to the actual region and role, not borrowed from a national average. Labor is substantial and belongs at the top of the model. It simply is not the whole case, and the three drivers that follow are where the rest of the return lives.
Driver two: quality improvement and scrap reduction
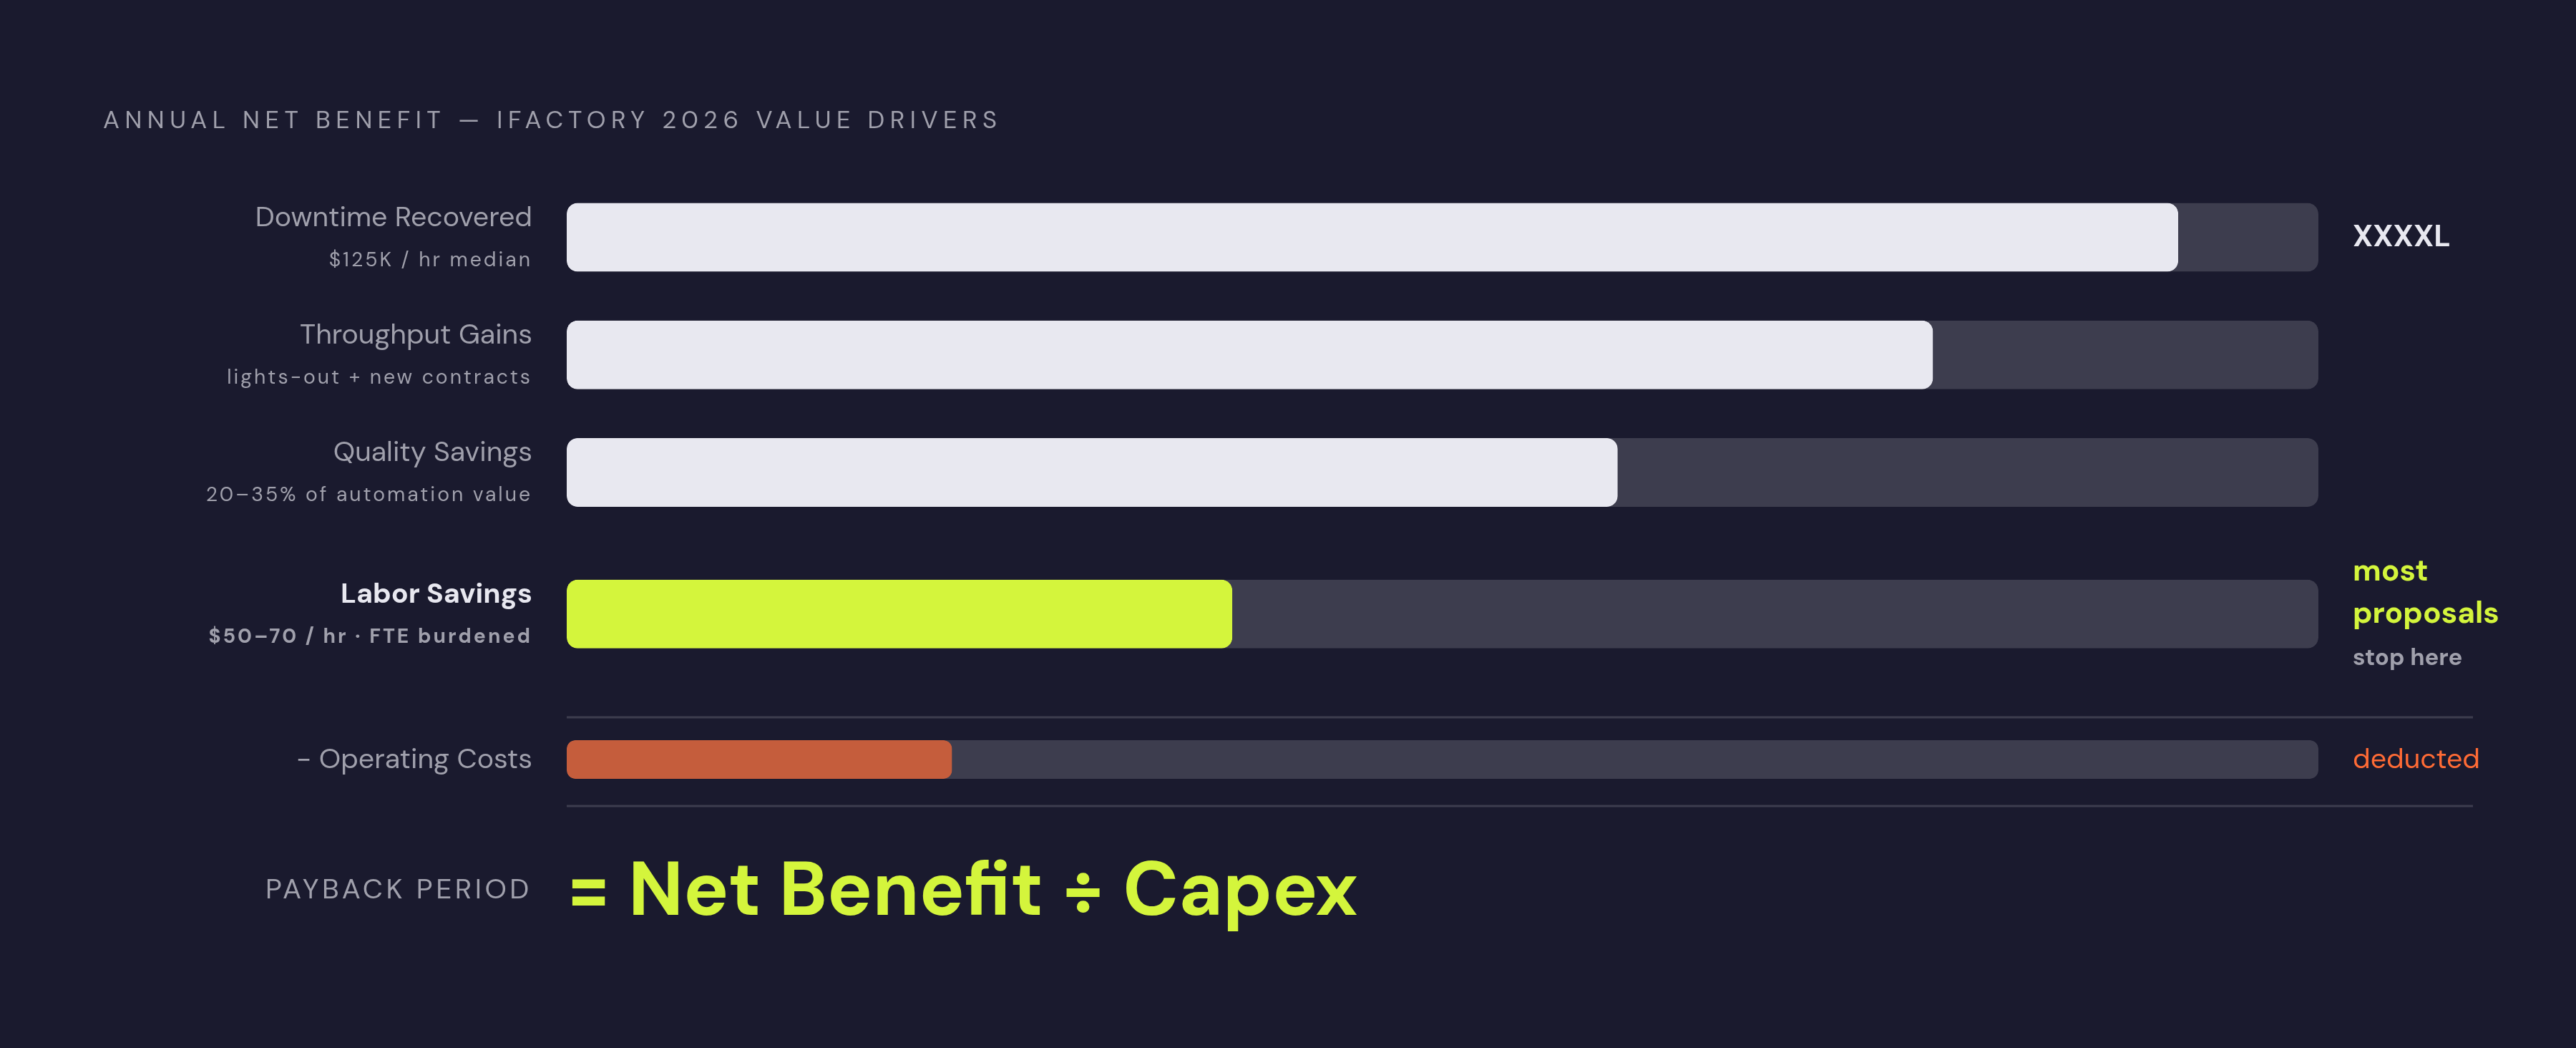
Quality is the first of the three drivers that most proposals leave out entirely, and it is rarely a minor one. In high-defect environments, it can outweigh the labor line. Oxmaint's guide puts quality and rework reduction at roughly 20 to 35 percent of total automation savings, making it the second-largest driver in most deployments.
Process consistency drives that number. A robot follows the same programmed parameters on the ten-thousandth cycle as it did on the first, eliminating the variation that comes from human fatigue and differences in operator skill. In welding and precision assembly work, rework rates can fall from several percent down to well below one percent once that variation is removed. iFactory's 2026 data shows robot repeatability running far tighter than human operators, and AI vision systems layered on top for quality control can push scrap reductions as high as seventy percent.
Building this line into the model takes a specific calculation: the current defect rate minus the post-automation defect rate, multiplied by annual production volume, multiplied by cost per defect, with scrap material value recovery, eliminated rework labor hours, and reduced warranty claims added on top. Oxmaint's ROI guide documents a case from an electronics manufacturer whose robotic assembly investment paid back in 18 months, with a sharp drop in quality defects standing alongside labor and throughput as a core driver of that result.
That calculation only works if the baseline exists before the proposal is written. A plant that has tracked defect rates, scrap costs, and rework hours can build this line with confidence; a plant that hasn't has nothing to subtract from. The fix isn't to drop the driver from the model, it's to start measuring the baseline now, because quality is the line most often left out of automation proposals, and leaving it out costs the model more than any other single omission.
Driver three: throughput gains and the revenue they unlock
Throughput gains work differently from everything discussed so far. Labor, quality, and operating costs are all savings against something the plant already spends. Throughput is different: it's new revenue the business could not previously capture at all, from orders declined for lack of capacity, contracts never bid because the plant couldn't deliver, or demand met only through overtime at reduced margin instead of standard production economics.
Oxmaint's guide states the mechanism directly: the ability to run lights-out production during second and third shifts, and to expand capacity without expanding the facility itself, are real sources of automation value that have nothing to do with labor replacement. The electronics manufacturer case makes this concrete. A substantial increase in throughput let that company accept contracts it would previously have turned down, and it was that incremental revenue, not the labor savings sitting alongside it, that compressed the payback on a multi-million-dollar investment down to 18 months.
The calculation structure is straightforward: new capacity minus old capacity, multiplied by profit per unit, multiplied by capacity utilization rate, with reduced changeover time between product variants and eliminated overtime premiums added on top. Oxmaint's framework treats capacity and throughput gains as typically a meaningful share of total automation value, and the ceiling on this driver is set by shift count: a cell running three shifts captures three times the throughput value of the same cell running one, on the same capital base, which makes shift count the single biggest lever that most single-shift proposals leave on the table.
The objection that a plant doesn't have the demand to fill a third shift misses the point of the driver. Throughput value isn't contingent on demand that already exists. It includes the capacity to accept new contracts, shorten lead times to win business that was previously out of reach, and price competitively against competitors who have already automated. That revenue belongs in the model whether or not the third shift is running on day one.
Driver four: downtime avoidance and the OEE recovery it funds
Downtime avoidance is the driver most often waved off as speculative, and it shouldn't be. Once a plant has a baseline downtime cost, this is the driver with the most immediate, measurable financial floor of all four.
The reasoning is simple: an unplanned stop costs enough that even a partial reduction in how often it happens pays for a meaningful fraction of the project, and integrated robotic cells with predictive maintenance built in make that reduction measurable before the project is even approved, not just after. iFactory's 2026 guide reports a median downtime cost of $125,000 per hour in U.S. manufacturing, a number large enough that a modest cut in unplanned stops becomes a significant line in the annual savings total on its own. iFactory's framework states that well-deployed robotic cells with integrated condition monitoring cut unplanned downtime by a significant margin and deliver a meaningful lift in OEE.
The mechanism runs through predictive maintenance directly. AI-driven condition monitoring flags bearing wear, vibration anomalies, and thermal drift before they cause a failure, converting what would have been an emergency reactive stop into a planned maintenance window instead. That's the same mechanism that funds the OEE uplift described in the throughput driver above: fewer unplanned stops means more of the plant's scheduled run time actually produces output, which is precisely what the availability component of OEE measures. The two drivers aren't separate line items that happen to sit next to each other in the model. They compound, because the predictive maintenance investment that avoids one unplanned stop is the same investment that keeps the lights-out third shift running uninterrupted.
Building this line starts with the plant's actual unplanned downtime frequency and duration, the loaded hourly cost of that downtime including lost throughput, overtime needed to recover, and scrap generated during restart, with the projected reduction applied as a conservative savings estimate. A plant with already-low downtime isn't exempt from this driver either: it still captures the throughput-consistency benefit through the performance component of OEE, and predictive maintenance still extends the service life of high-value machines regardless of how often they currently fail. That extended asset life defers the capital replacement of expensive equipment, and the avoided capital expense is a real cash benefit that belongs in a multi-year view of the project even when the year-one payback number doesn't include it.
Two additional value lines that strengthen a board-ready model: safety and floor space
Beyond the four core drivers, two further lines round out a model built to withstand serious scrutiny: safety and floor space. Robotic cells remove operators from the specific tasks that drive the highest injury rates in manufacturing: repetitive heavy lifting, exposure to welding fumes and arc flash, and proximity to presses and other machinery capable of causing serious harm. Reduced incident rates lower workers' compensation premiums, cut the cost of lost-time injuries, and reduce the regulatory and legal exposure that follows a serious workplace accident. A labor-only model omits that, yet it is real money that a board can be shown.
Floor space works similarly. A cell that replaces a manual workstation often has a smaller physical footprint once tooling and fixtures are accounted for, and the capacity gained from running that cell across multiple shifts means a plant can expand output without leasing or building additional square footage. That avoided facility cost belongs in the same category as the avoided capital expense described in the downtime driver: it may not land in the year-one payback calculation, but it is a real, defensible number over the life of the investment, and leaving it out of the model means leaving a true part of the return on the table.