Maintenance Cost Benchmarks for Industrial Robot Fleets
The 5-to-15% annual maintenance rule hides unplanned failures that cost multiples more.

Vendor proposals lead with hardware price because it's the easiest number to compare across suppliers, not because it's the number that determines what a robot actually costs to own. The arm itself, whether from Fanuc, ABB, KUKA, or Yaskawa, is only a fraction of what gets spent on a deployed cell once end-of-arm tooling, integration labor, safety fencing, and the surrounding process equipment are added in. A fully built cell runs well past the arm's sticker price before a single part has been produced. That gap is the start of a pattern that holds for the whole operating life of the machine: across a 7-year horizon, total cost of ownership typically reaches several times the initial capital outlay once maintenance, consumables, and spare parts are folded in. That multiple, not the quote on the purchase order, is the number that should set the budget for any fleet of robots. The layers that pile up after installation, routine maintenance, worn parts, replacement components, periodic upgrades, appear the same way across robot types and planning horizons. They are not surprises that better procurement can negotiate away; they are built into what owning a robot means.
The core annual maintenance range and the 5–15% figure
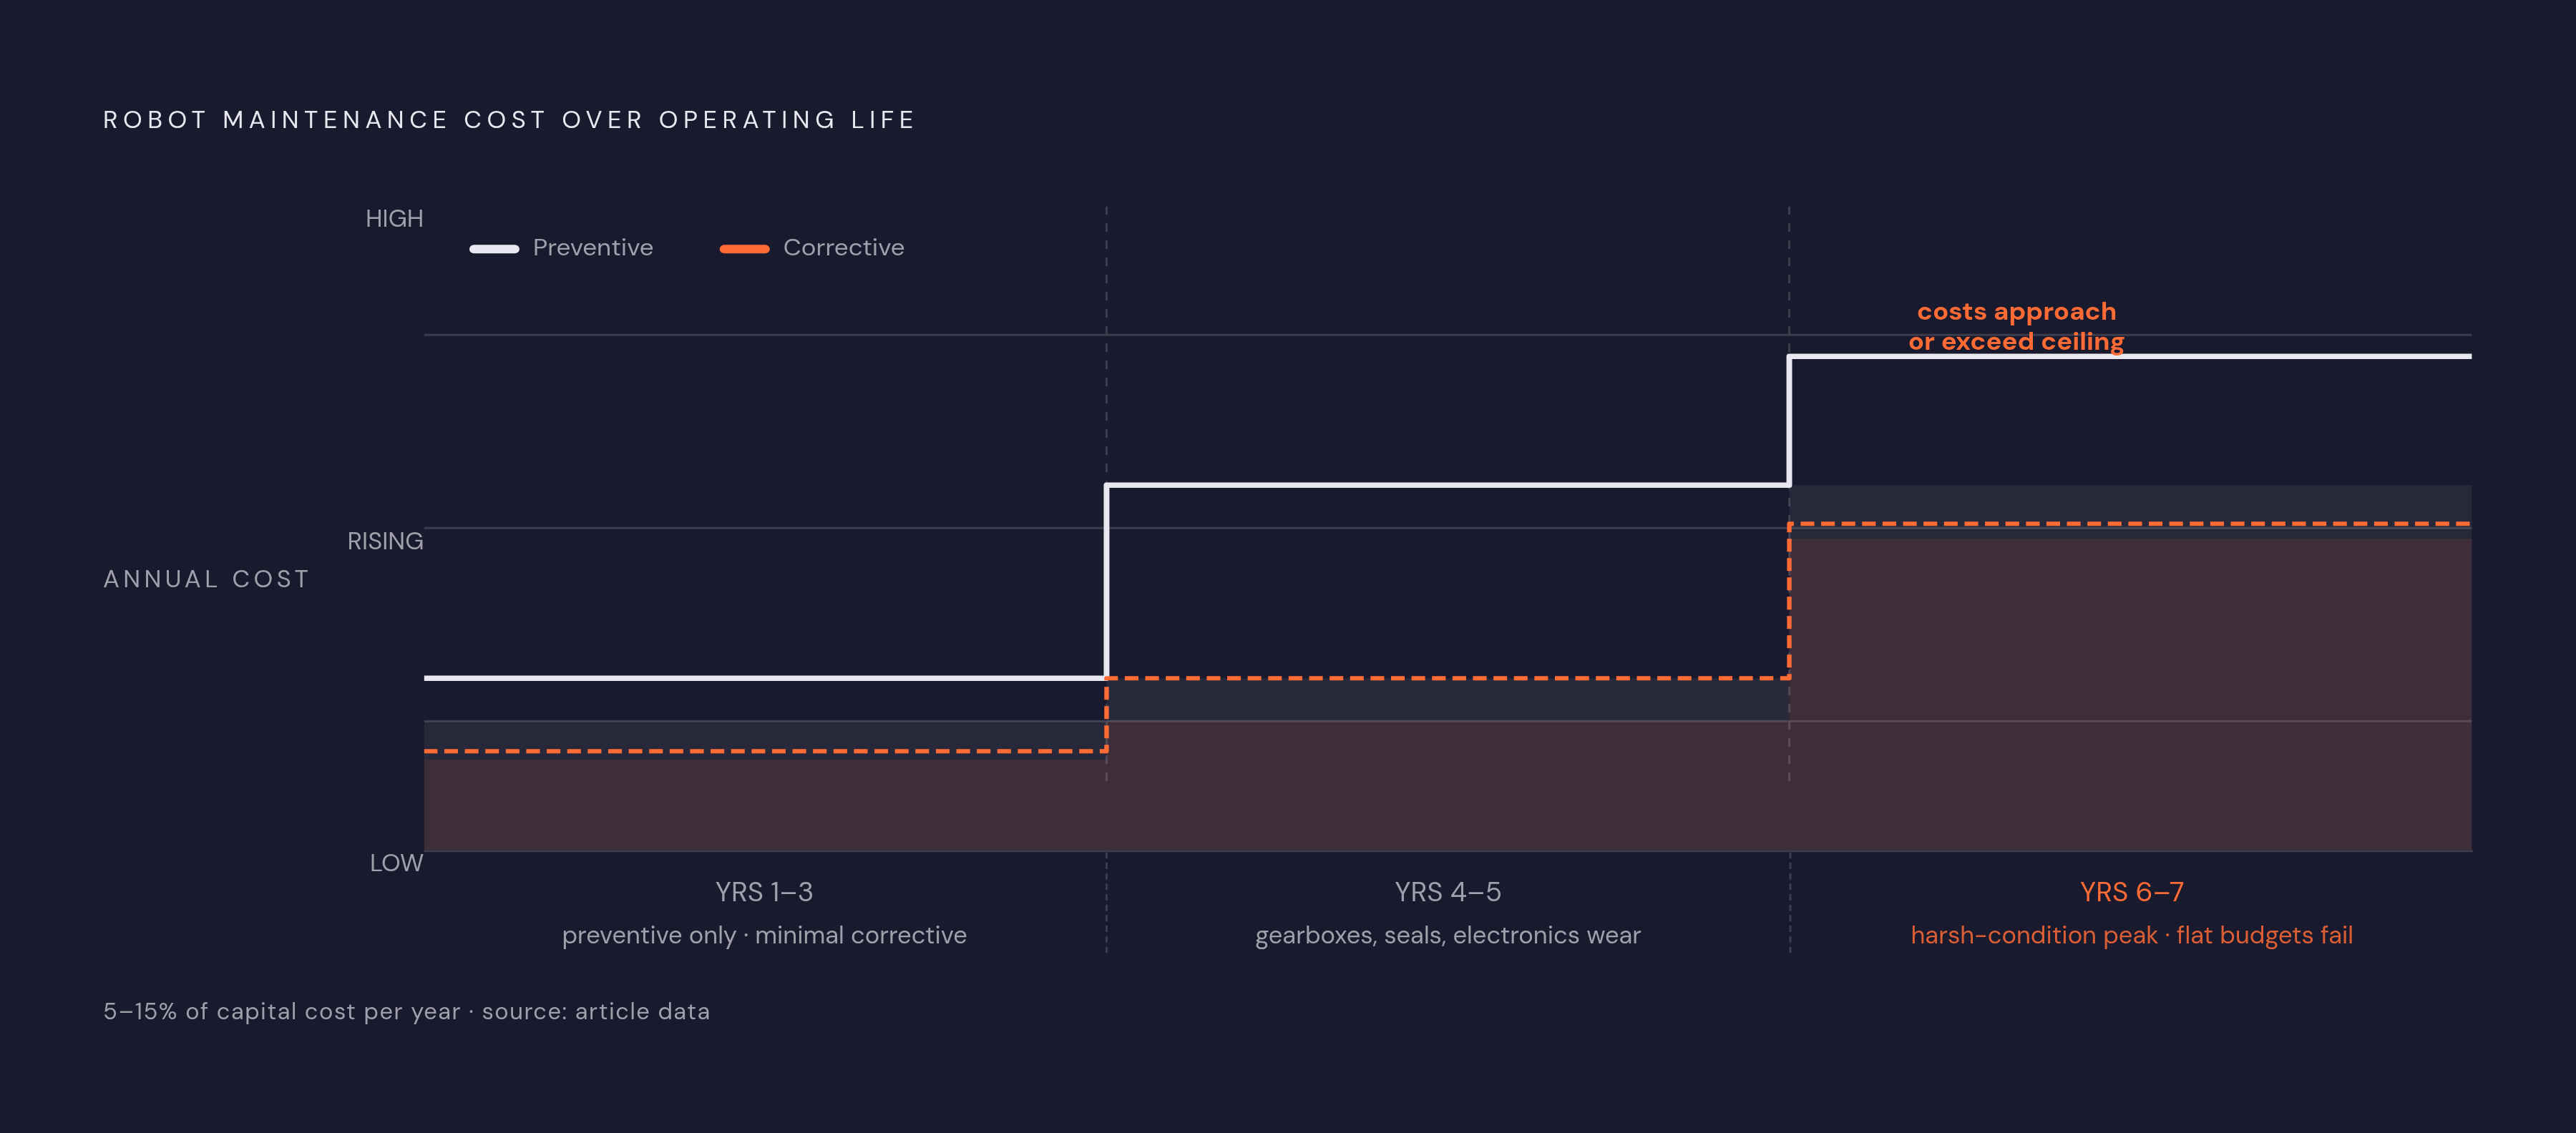
The benchmark most fleet operators have heard, that industrial robot maintenance runs 5 to 15% of purchase price per year, holds up as a real pattern, with a logic that explains why a given robot lands where it does in that range. For a representative robot priced in the six figures, that range translates into thousands of dollars a year in scheduled costs: preventive service, spare parts, and the occasional repair that falls outside a maintenance contract. The same percentage range is the one typically cited against installed cost for industrial robotics deployments broadly, so it travels well across different ways of pricing a project. Where a given robot sits in that band changes by age in a predictable way. In years one through three, preventive maintenance is at the low end of the range and corrective costs stay minimal. By years four and five, both preventive and corrective costs climb as wear accumulates in gearboxes, seals, and electronics. By years six and seven, costs approach the top of the range or exceed it, especially for robots running in harsh conditions. Looked at over the robot's full service life, maintenance (labor, parts, downtime, and service contracts combined) makes up a substantial share of total cost of ownership on average. That lifetime share and the annual 5 to 15% figure are not in tension: the lifetime number reflects a share of a multi-decade TCO calculation that includes capital amortization, while the annual range is a year-to-year cash-flow benchmark operators can budget against directly. If a vendor quotes a lower maintenance number, you should read it carefully before you trust it over the benchmark. Vendor maintenance estimates typically cover only scheduled labor and standard consumables. They tend to exclude unplanned repair costs, downtime costs, and the labor tied to software updates, and that exclusion is what makes a vendor quote look better than it will turn out to be in practice.
How robot type shifts the maintenance baseline before environment
A fleet running AMRs alongside 6-axis arms cannot be budgeted from a single blended percentage. Robot architecture changes the maintenance profile before you even factor in anything about the plant floor. Standard 6-axis industrial arms from established manufacturers like Fanuc, ABB, KUKA, and Yaskawa tend to cost toward the middle of the annual range: these platforms have long mean-time-between-failure track records and dense global service networks, both of which make their maintenance spend easier to predict. Autonomous mobile robots carry a lower per-unit cost but concentrate their maintenance burden in specific wear items: wheel tread, LiDAR optics, and battery capacity fade driven by charge cycles, temperature, and depth of discharge. Those are the items easiest to neglect on a single robot and most expensive to neglect across a fleet of dozens. Payload class adds another layer of variation within arm types. Heavier-payload robots need larger joints, higher-torque motors, and heavier gearboxes, and each of those components adds cost nonlinearly, both to the robot itself and to its maintenance, particularly around gearbox service intervals. Humanoid and other next-generation platforms deserve a brief caution here rather than a full treatment: fleet-scale MTBF data for these platforms barely exists at this stage, so the published 5 to 15% benchmark cannot be trusted for them the way it can for mature arm and AMR categories. Operators evaluating these platforms should treat the upper end of the standard range as a floor rather than a ceiling, because the benchmark's reliability gets weaker the newer the architecture is. The broader point holds regardless of platform: knowing where a given robot type sits before estimating environment effects keeps the budget honest.
Unplanned downtime cost versus the scheduled maintenance line
The scheduled maintenance line is not where the financial risk in a robot fleet actually lives. A single unplanned failure event can cost more than an entire year of scheduled maintenance combined, and that asymmetry is what the 5 to 15% benchmark alone does not protect against. A typical 6-axis industrial robot might run a few thousand euros a year in scheduled service, but one unplanned failure, a burned-out servo motor, a contaminated reducer, a corroded cable harness, can cost several times that figure once downtime and lost production get added to the repair bill itself. Maintenance-related downtime accounts for a meaningful share of all lost production time in automated plants, and in continuous-production environments, the cost of an hour of unplanned stoppage runs into the hundreds of thousands of dollars. Most plants, once they look closely at where their maintenance dollars actually go, find that a small fraction of their assets consumes the majority of the budget. Finding those assets early, through fleet-level tracking rather than treating every robot in the fleet as interchangeable, is what lets an operator see the real concentration of risk instead of budgeting on an average that hides it. Reactive maintenance, waiting for something to break rather than scheduling prevention around it, compounds all of this. It drives up downtime costs well beyond what a scheduled approach would cost, and it stacks on emergency call-out fees, rush charges for parts shipped on short notice, and the secondary failures that often cascade from a single component going down. A multi-robot AMR deployment left wheel tread wear, LiDAR dust accumulation, and battery cycle counts untracked, with no structured preventive schedule in place, and uptime fell sharply over a period of months as those neglected wear items compounded into failures. But once that kind of fleet puts structured tracking in place, covering the same wear items that caused the decline, the pattern reverses. The mechanism, not the specific operator, is the lesson: wear items that are cheap to monitor become expensive once they're ignored at fleet scale.
Preventive and predictive maintenance programs and the cost trajectory
Structured preventive maintenance isn't an added expense layered on top of the maintenance budget. It shifts spending from high-variance, unpredictable corrective cost into low-variance, scheduled cost, which improves uptime and makes the budget itself easier to forecast. Facilities that run structured preventive maintenance programs reach much higher uptime than those that rely on reactive-only approaches, and the gap is large enough to mean a real difference in production capacity at fleet scale. Preventive maintenance delivers a strong return relative to a reactive, fix-when-broken approach precisely because it removes the cost multipliers that come with unplanned failure: emergency labor rates, overnight parts shipping, and the cascading effect a single failure can have on an entire production line. You can move beyond calendar-based preventive maintenance to condition-based or AI-driven predictive maintenance, using sensor data to time interventions around actual signs of wear. The U.S. A federal energy efficiency program has documented that this kind of approach reduces breakdowns and maintenance costs, and that maintenance practices combining preventive and predictive elements can extend equipment lifespan. The gains are real but conditional. They depend on mature sensor coverage and tight integration between condition monitoring and maintenance dispatch, and an organization still early in deployment, with only partial sensor coverage, should expect gains at the lower end of what's achievable. That doesn't mean predictive maintenance is out of reach for fleets without full sensor coverage. Even a structured, paper-based or digitally tracked preventive schedule, without any AI component at all, closes most of the gap between a purely reactive approach and a fully predictive one. The lesson for budget planning is that the size of the investment in monitoring technology matters less than whether a structured schedule exists.
The vendor-contract versus in-house crossover point
The TCO model eventually turns into a staffing and contracting decision: who performs the maintenance work, and at what fleet size does the answer change. Vendor service contracts offer a predictable per-robot annual cost and access to manufacturer-certified technicians, so they make the most sense when a fleet is too small to justify dedicated maintenance headcount. Below roughly ten robots, vendor contracts tend to be the more economical choice, unless the same technicians can also maintain other equipment on site, which then shifts the math toward keeping that capacity in-house even at small scale. In-house maintenance becomes cheaper than a vendor-only arrangement once a fleet grows past that threshold, because technician salaries are a fixed cost that spreads across a growing number of robots, while vendor costs scale linearly as you add each unit to the contract. The structure that has become dominant for mid-to-large fleets is a hybrid model: in-house technicians handle routine and scheduled maintenance, which makes up the majority of maintenance work by sheer frequency, while a reduced vendor contract stays in place for complex, manufacturer-level interventions that require specialized expertise. That combination lowers total annual maintenance labor cost compared to a vendor-only arrangement, and it keeps access to repair capability the in-house team can't provide on its own. At scale, fleet-wide vendor contracts spanning multiple sites carry a per-robot cost discount compared to negotiating site by site, so growing fleets have a clear incentive to consolidate their vendor relationships. This decision is also getting harder to defer. The skilled maintenance technician workforce is aging, with a large share of operators and technicians now over 45 and the average technician age climbing past 50 in some assessments, a structural trend that raises the cost and difficulty of staffing in-house maintenance capacity over the coming years regardless of which model a given fleet chooses.
Building a practical fleet maintenance budget from the benchmarks
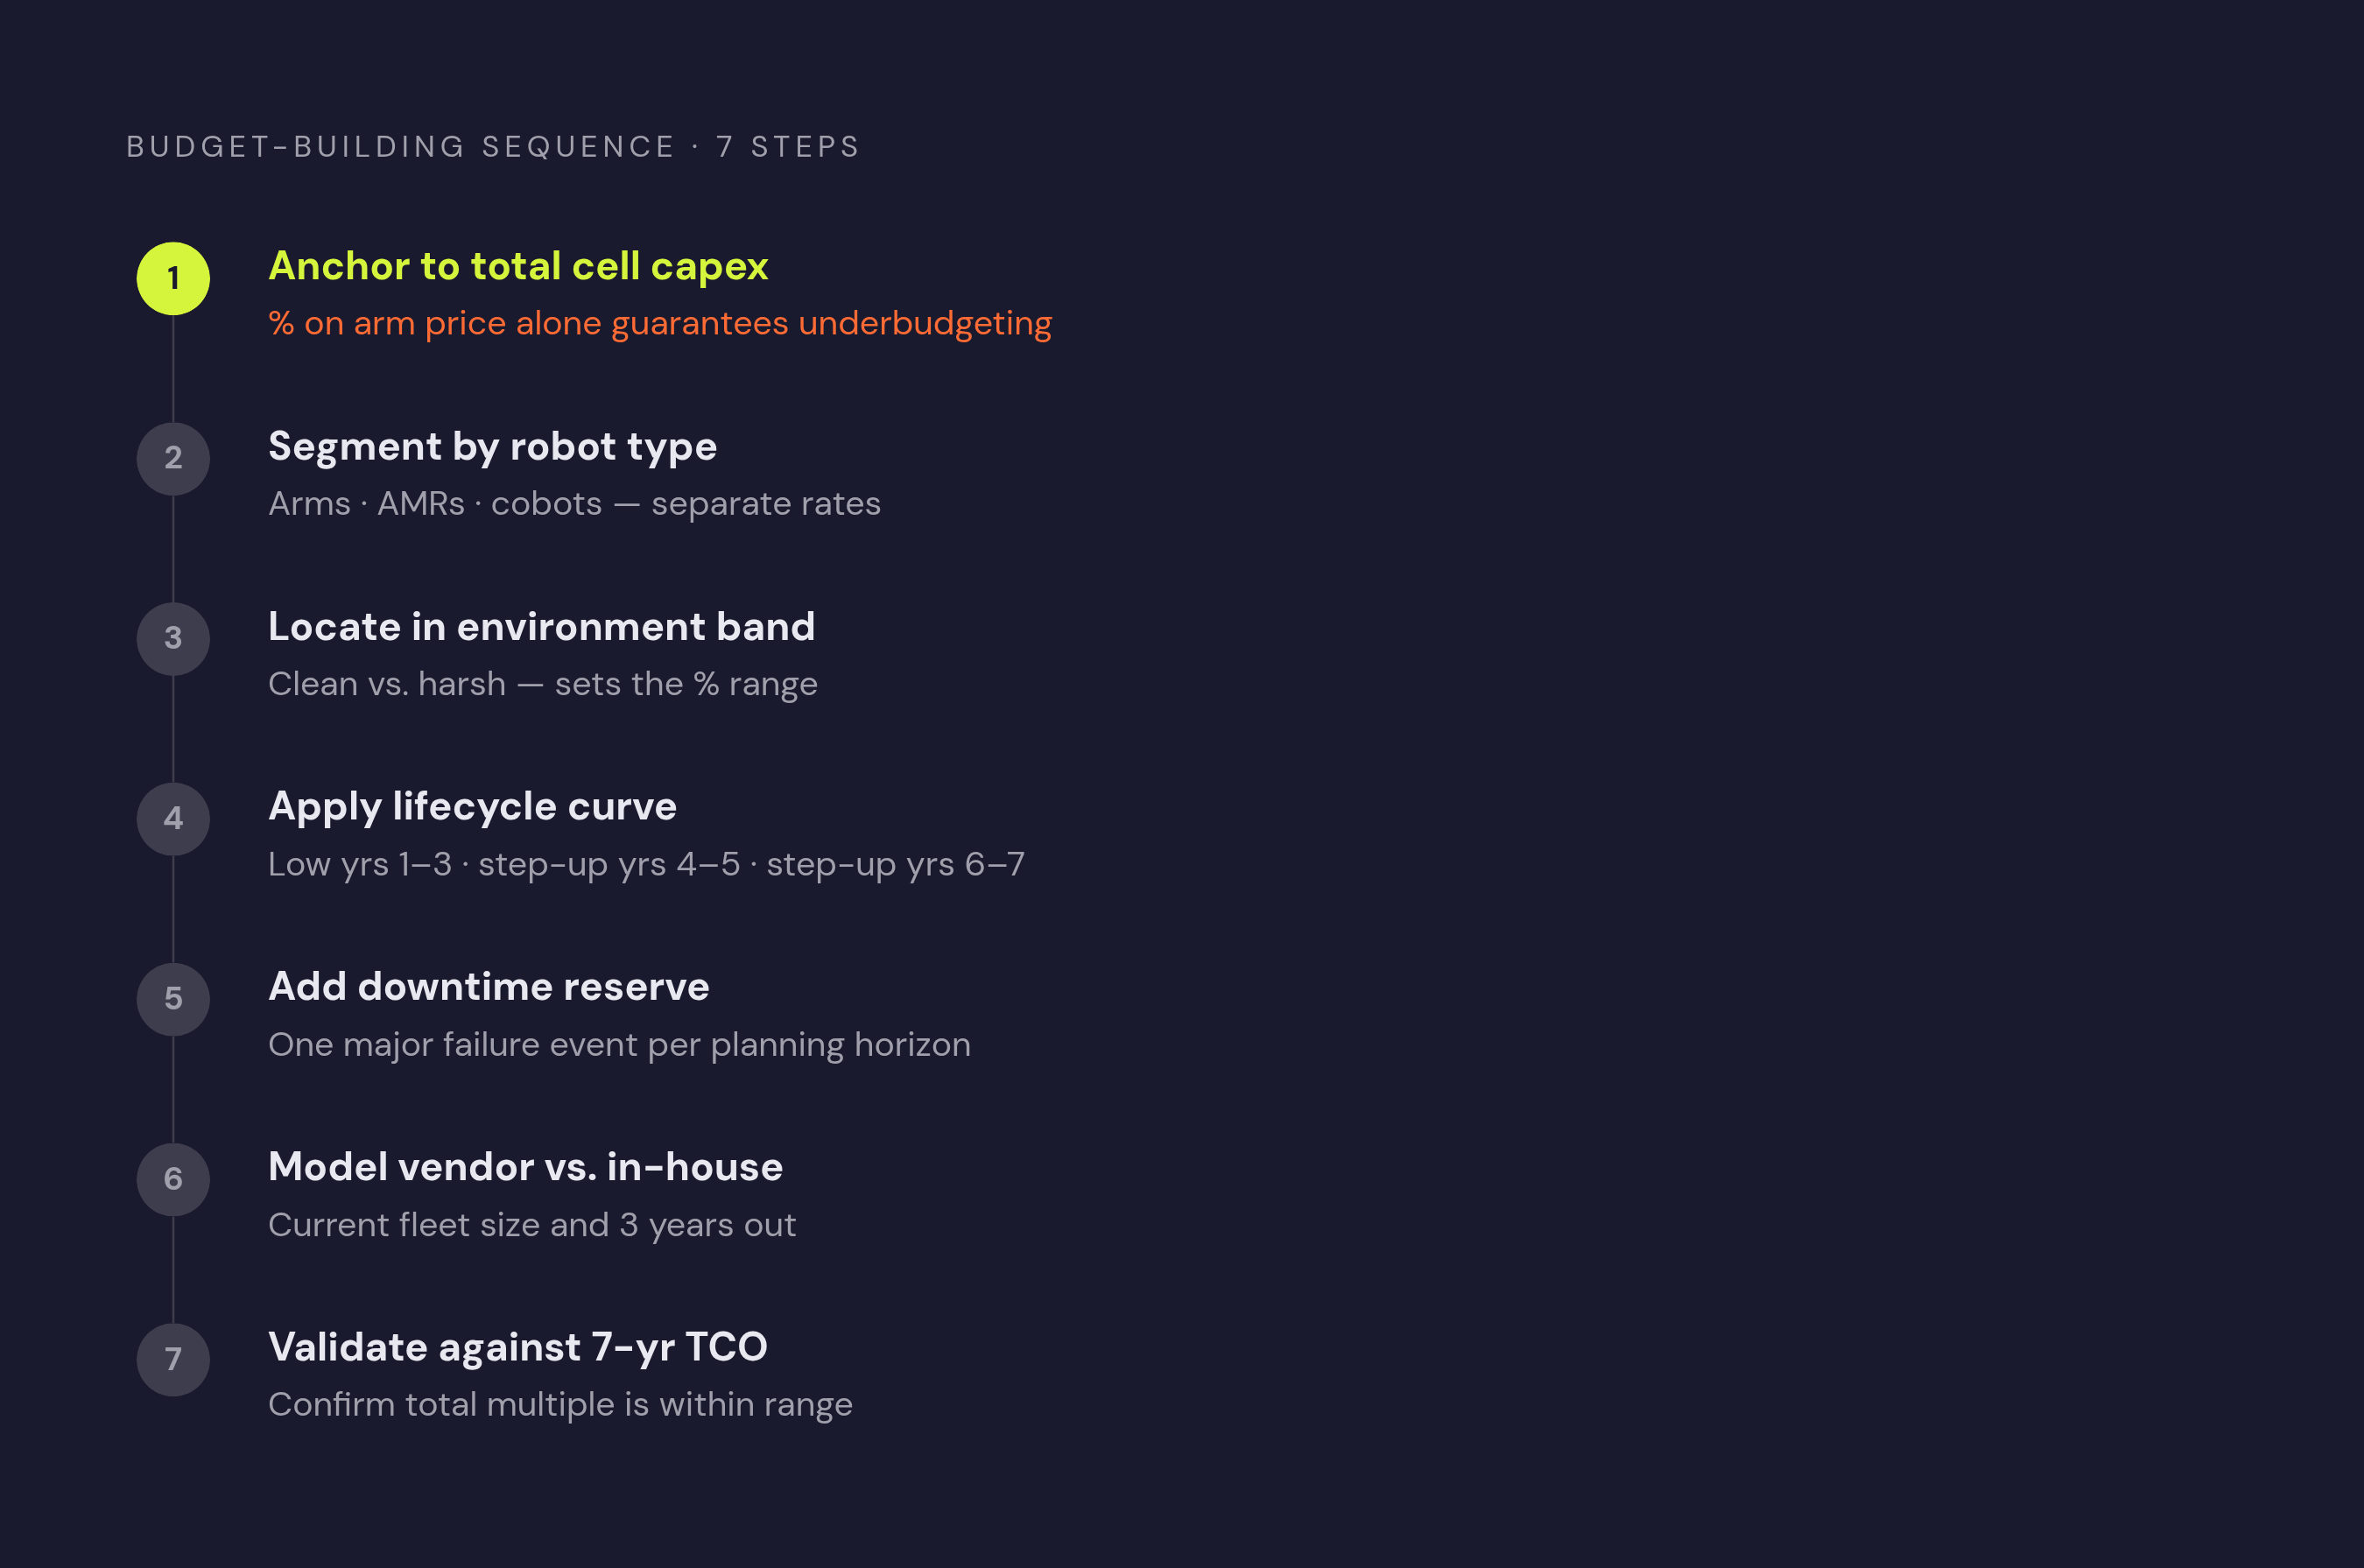
The benchmarks above support a budget model an operator can build before deployment. The first step is to apply the maintenance percentage to the total cell capex rather than the arm price alone, since the arm is only a portion of what the cell actually cost, and anchoring the percentage to arm price alone guarantees systematic underbudgeting. The second step is to segment the fleet by robot type rather than apply one blended figure across it: industrial arms, AMRs, and cobots carry different baselines, and a mixed fleet needs a weighted average built from those type-specific numbers rather than a single average pulled from the whole range. The third step is to locate each robot within its type's range according to its operating environment. Robots running in clean, climate-controlled conditions budget toward the low end of the annual range, while robots exposed to dust, heat, or chemical mist budget toward the high end, since contamination-heavy environments are consistently one of the strongest cost drivers in the data. The fourth step is to apply the lifecycle curve rather than a flat annual number: scheduled maintenance spend should be modeled lower in years one through three, with explicit step-ups built in for years four and five, and again for years six and seven, since a flat budget that ignores aging will come up short in the second half of the operating horizon. The fifth step is to add a downtime reserve on top of the scheduled maintenance line, since that line by design excludes the cost of unplanned failure. That reserve should be calibrated to the cost of a single major failure event for the fleet's most critical robots, so the corrective tail doesn't blow through the annual budget the way it does for operators who only plan around the scheduled figure. The sixth step is to model the vendor-versus-in-house decision explicitly, both at the fleet's current size and at its planned size three years out, because the crossover point between the two options changes the underlying labor cost structure substantially as a fleet grows. The seventh step is to validate the full model against the 7-year total cost of ownership benchmark established at the outset: a budget built correctly through the first six steps should converge on that multiple of capex established earlier, and a model that lands well outside that range is a signal to go back and check which step underestimated the real cost of keeping the fleet running.