Energy Cost Benchmarks for Industrial Robot Cells by Payload Class
Motion profile, speed, and idle mode matter far more than payload class alone for energy budgets.

An engineer sizing a new robot cell, or an operations manager auditing an existing fleet, almost always starts in the same place: the payload rating on the spec sheet. It is the number every catalog leads with, the figure that determines which robots even qualify for a job, and the easiest variable to sort a fleet by when building an energy budget. But payload class alone cannot close that budget, and it cannot validate a benchmark built from datasheet values. A 2025 scoping review published in Machines documents that a single heavy-class 6-axis robot can draw vastly different power levels depending on its motion profile, and that ratio is large enough to make naive comparisons across payload classes misleading. That spread is the fingerprint of three factors layered on top of payload capacity: task mix, speed setting, and idle regime, each of which this article unpacks in turn. None of this means payload class should be discarded as a starting point. It still anchors the structural energy floor of a cell: a cobot rated for a few kilograms physically cannot draw what a heavy-duty palletizer draws at full cycle, so the gradient between tiers is real even where individual robots at the edges of adjacent tiers overlap. The deeper complication is that no global standard yet governs how manufacturers measure and report these figures in the first place; this article addresses that later.
The power-consumption gradient across payload tiers, from cobots to heavy-duty arms
A documented hierarchy of power draw runs from sub-kilowatt collaborative robots to multi-kilowatt heavy-duty arms, but the range within each tier is wide, so neighboring tiers overlap at their edges. At the lightest end, the cobot tier covers robots rated for roughly 20 kg of payload or less. The 2025 scoping review surveyed dozens of cobots rated for 0.5 to 20 kg and found power consumption ranging from well under 0.1 kW to just under 1 kW, with a median around 0.25 kW, a figure the review describes as remarkably restrained compared to conventional industrial robots.
The mid-range industrial tier, centered around 60 kg payload capacity, draws a lot more. The scoping review places traditional industrial robots at an average around 3 kW, with peak draws measured as high as roughly 12 kW for the KUKA KR60HA and over 15 kW for the KUKA KR210 R2700 under peak acceleration. A comparative study cited in the review found that a typical industrial robot running at roughly 3 kW average for a standard operational day accumulates around 21,915 kWh a year, a figure useful for fleet-level planning.
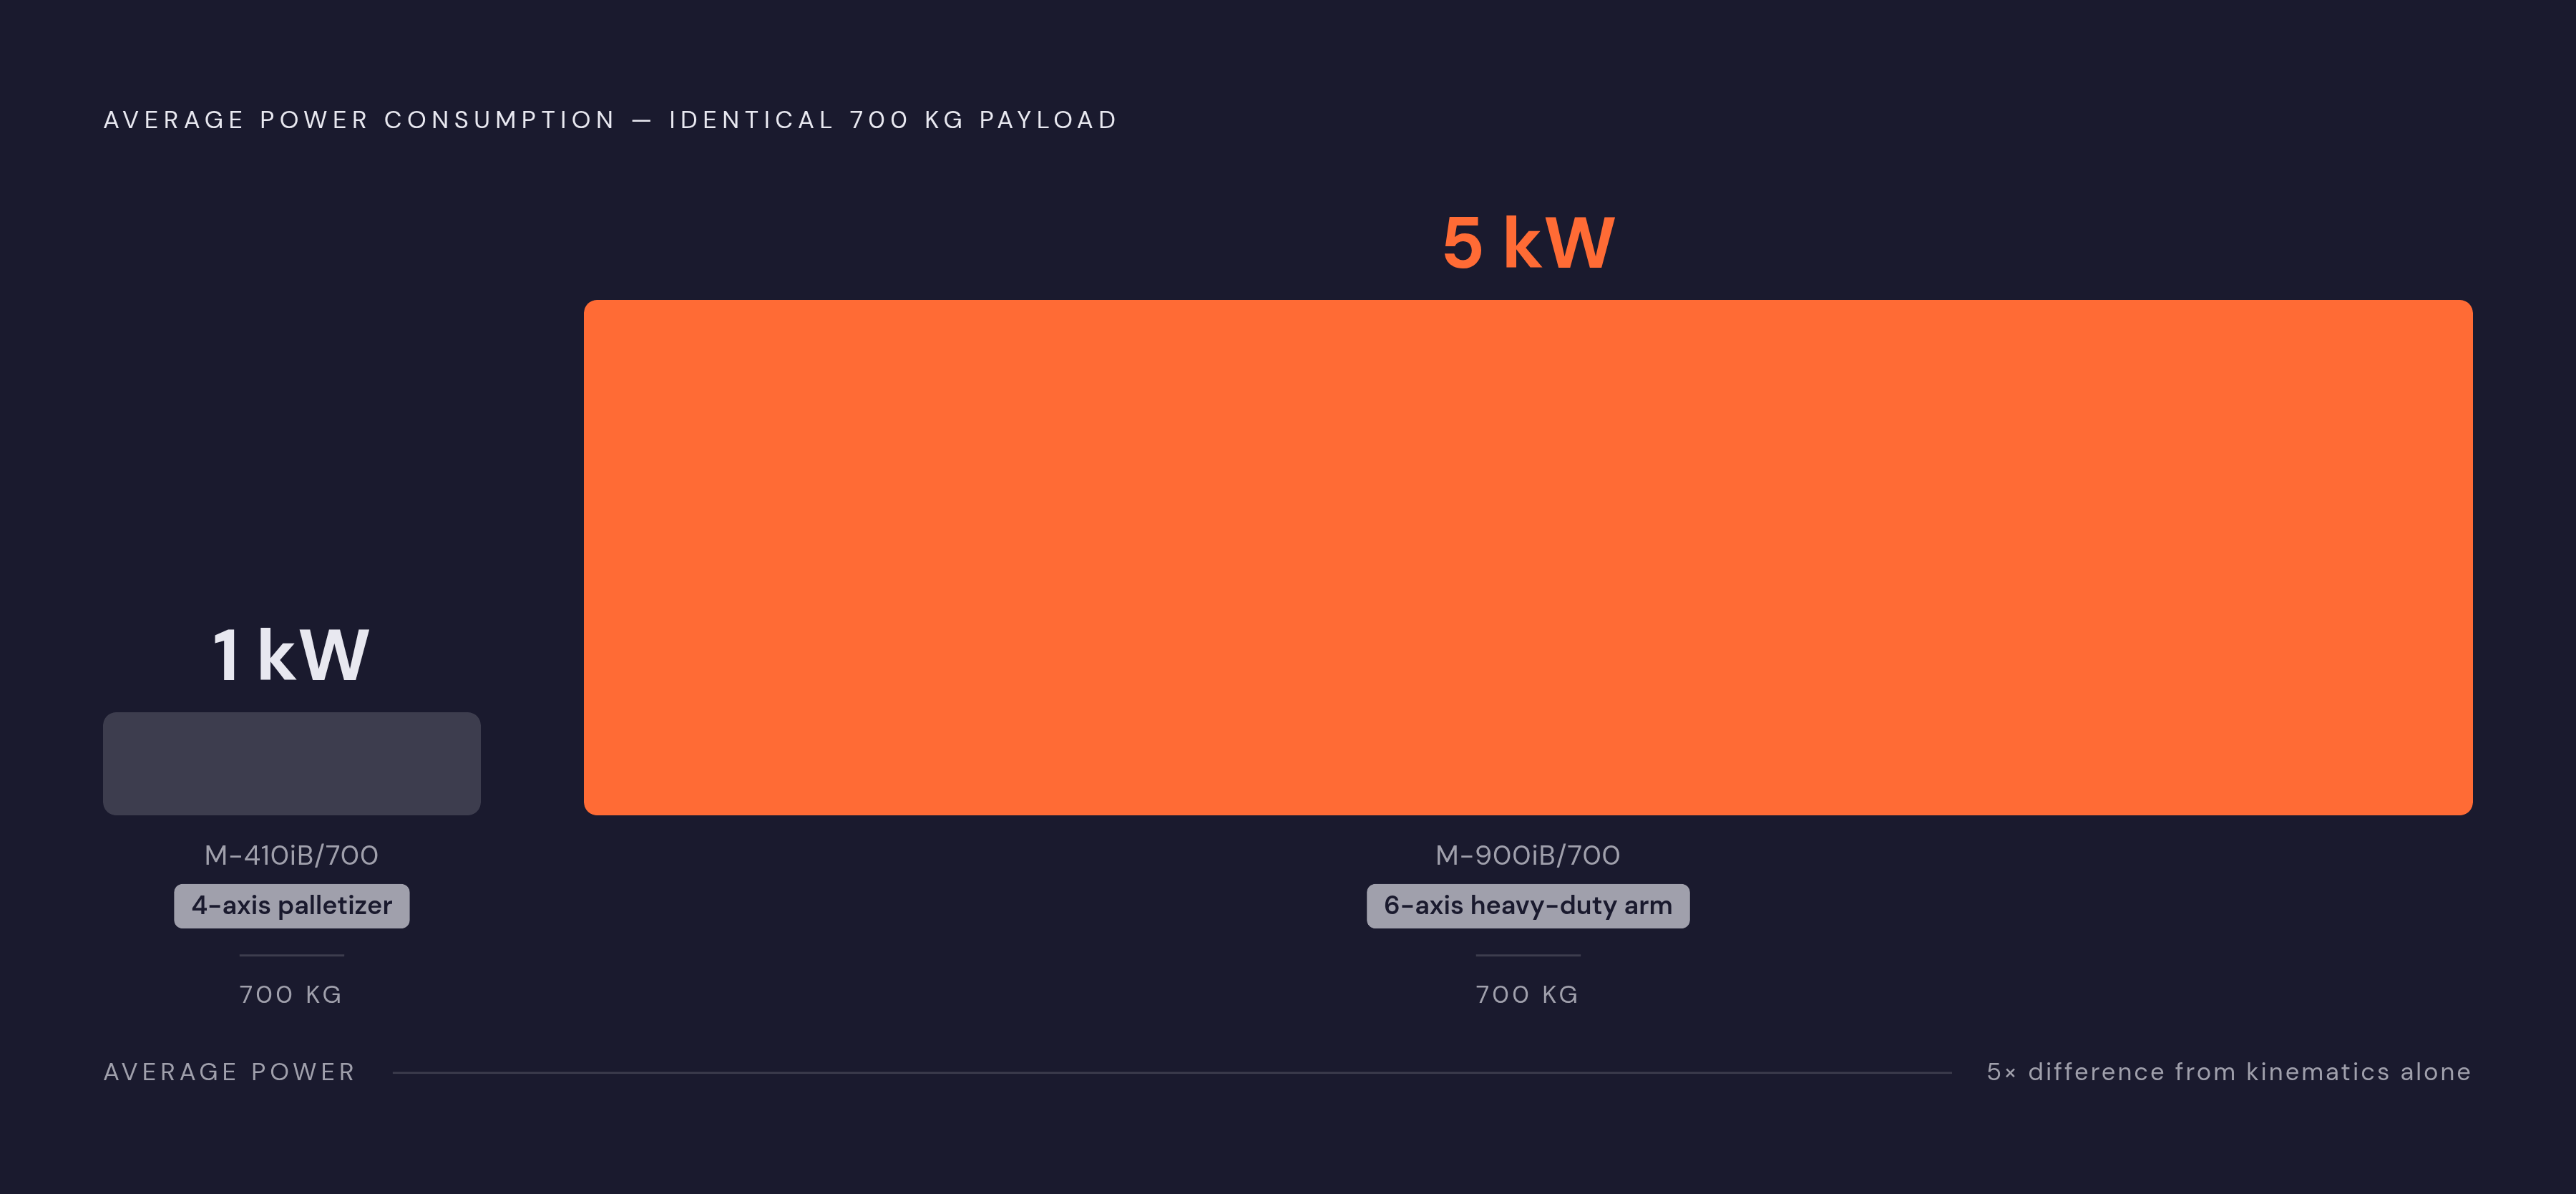
In the heavy-payload tier, centered around 210 kg, lifecycle energy exposure reaches a scale where energy becomes a first-order input into total cost of ownership. And at the very heavy end, the 700 kg palletizing class produces the clearest illustration in the entire dataset of what payload class can and cannot tell an engineer. The FANUC M-410iB/700, a 4-axis palletizer, runs at roughly 1 kW average according to its datasheet. The FANUC M-900iB/700, a 6-axis heavy-duty arm carrying the identical 700 kg payload rating, runs at roughly 5 kW. Two robots with the same nameplate payload differ in power draw by a factor of five. Kinematics, specifically a 4-axis versus a 6-axis architecture, explains that gap as much as mass does, and duty cycle compounds it further. The scoping review formalizes this structure into six load-capacity classes spanning 0 to 250 kg in 50 kg increments, plus a class above 250 kg, and the ISO standardization effort described later in this article is expected to build on this taxonomy directly.
Energy variance within a payload tier: task mix, speed, and idle regime
Once a robot's payload class is fixed, three levers determine where its actual energy draw falls within that class's range, and together they can swing consumption by multiples. These are not independent variables an engineer can tune one at a time and expect proportional results. They interact, and a benchmark that accounts for only one of them will miss the others.
Task mix sets the floor and ceiling of what a robot's motors are actually asked to do. Industry data shows consumption ranging from roughly 1 kWh to 30 kWh per hour depending on application and size, with welding and heavy forming at one extreme and vision-guided inspection at the other, even within a single payload class. A robot's draw reflects the specific sequence of joint torques its task demands rather than the capacity printed on its spec sheet: a 200 kg-rated arm performing light assembly work behaves, energetically, much closer to a mid-range industrial robot than to a heavy-payload one.
Speed setting is the most direct lever an engineer can adjust without reprogramming a cell from scratch. Research establishes a practical efficiency band between roughly half and full rated maximum speed, where cycle time and energy use balance well, and if you keep payloads well below rated maximum, they run most efficiently, particularly at lower speeds. If speeds push above that band, they waste energy on acceleration without a proportional gain in throughput. Speeds kept well below it extend cycle time and prolong idle periods, which introduces the third variable. RoboDK's analysis of robot motion programs confirms that speed reduction is one of the most accessible single-parameter changes available to an existing installation, requiring no hardware change.
Idle regime is the variable most often ignored in a budget built from active-cycle figures alone. Traditional industrial robots consume a large share of their peak power even when performing no task, and industry sources place idle draw in a range that can reach the majority of peak draw. Many modern robot controllers offer low-power standby or eco-mode settings, but these are rarely enabled by default. You need to coordinate with automation engineers to write sleep and wake logic that respects cycle timing, and powering a robot down entirely during shift transitions, lunch breaks, or weekend stoppages is a straightforward intervention that gets overlooked more often than it should.
One structural factor offsets these costs at the hardware level rather than the software level: regenerative braking. Industry analysis finds that regenerative braking in robotic systems can recover a meaningful share of expended energy, particularly in high-speed, high-cycle applications where deceleration events happen frequently. Servo drives or controllers built with regenerative capability require upfront capital, but the reduction in net draw compounds across a large fleet in a way that single-cell savings do not.
Why the arm-only benchmark understates real cell energy exposure
Published benchmarks overwhelmingly report arm-only power figures, so they understate how much energy a working cell actually uses. End-of-arm tooling, sensing equipment, control hardware, and auxiliary machinery all add load that scales with the application. The scoping review notes that robotic systems account for a substantial share of total energy use in advanced manufacturing, and argues that this footprint has to be broken down by subsystem, covering motion, control, sensing, and tooling separately, before it becomes something an engineer can actually act on.
A welding cell's power source, a vision system's illumination array, or a conveyor feeding a palletizer can each represent meaningful additional draw that never appears in an arm-only comparison pulled from a datasheet. Energy optimization research treats the full cell as the proper unit of analysis for this exact reason: a trajectory that saves energy at the joint level can do so by extending cycle time, during which every peripheral device in the cell keeps drawing power the whole time. A 2025 paper by Ruzarovsky and colleagues, published in Machines, lays out a methodology for designing robotic manufacturing cells that optimizes workplace layout and minimizes both energy and time costs together, and it shows that cell-level energy accounting is moving into territory adjacent to formal compliance frameworks like ISO 50001.
The practical consequence for anyone benchmarking by payload class: treat the arm-level figure as the floor of total cell exposure, not the ceiling, and layer in the peripheral loads specific to the task at hand before calling a number final.
Trajectory optimization and layout design limits within each tier
Trajectory optimization and layout redesign can produce real, documented savings inside each payload tier, and several named cases show the range of what you can achieve. An ABB IRB 6740 operating in an automotive body shop context saw energy consumption drop by 33.95 Wh per cycle after a layout-optimization methodology was applied, which corresponded to EUR 131.03 in annual savings per robot, a modest figure in isolation but a meaningful one across a fleet of dozens of identical cells. The KUKA KR 210-2, representative of the heavy-payload tier, achieved a reduction of up to roughly 10% in energy consumption through trajectory optimization alone. An ABB IRB1600 performing a custom pick-and-place operation saw meaningful improvement from energy-optimal path planning, and in that case the fastest energy-optimal trajectory came out marginally faster than the commercially available fastest trajectory, a rare instance where the energy goal and the cycle-time goal pointed the same direction.
These results come with a ceiling. Gains from parameter tuning in repetitive, short-cycle applications run into limited access to low-level control parameters on commercial controllers, the need to re-tune settings as payload conditions vary, and the hard constraint that cycle time targets still have to be met regardless of the energy objective. Stacking multiple software interventions onto the same cell rarely produces additive savings. Diminishing returns set in after the first or second change, and an engineer expecting a 10% trajectory gain and a layout gain to simply add together will usually be disappointed.
None of this makes software-side optimization a dead end. It is a bounded tool, one best used in combination with the structural and hardware-level changes covered next. You can use tools like the open-source EcBot MATLAB library and emerging data-driven IoT benchmarking approaches to simulate these optimization scenarios before you commit to a physical layout change, so finding out where that ceiling sits for a given cell costs less.
Hardware-generation effects: why historical benchmarks age out faster than most engineers expect
KUKA's Fortec-2 KR 420 R3100-2 weighs substantially less than its predecessor, and that weight reduction alone requires meaningfully less energy to move the arm at equivalent speeds and accelerations. One KUKA manufacturing customer that upgraded to current-generation models documented a meaningful reduction in fleet energy use as a result. That case illustrates a pattern that runs through the entire payload-class gradient described earlier: hardware generation drives the benchmark numbers attached to a given class, because the hardware generating them keeps changing over time.
Industry data documents that energy consumption for specific robot models has fallen by around 60% compared to older-generation equivalents over the past decade, and that trend is expected to continue as new materials and control architectures reach production. Lightweight structural design is the primary mechanism behind that improvement. Analysis of lightweight robotic designs finds that structural weight reduction alone accounts for meaningful energy savings independent of any software or control improvement, because a lighter arm needs less motor torque to accelerate itself through the same motion.
The consequence for benchmarking practice is direct: a figure drawn from a 2015-era arm may be materially too high for a current-generation arm in the same payload class. An engineer who inherits a legacy benchmark risks over-budgeting energy costs for a new installation, or worse, failing to build a credible business case for retiring older equipment because the comparison understates how much a refresh would actually save. Payload-class ranges have to be read as generation-specific figures. The source date attached to any published benchmark carries as much weight as the methodology used to produce it.
The standardization gap that makes cross-vendor benchmarking unreliable today
Consumer appliances have standard test protocols: a refrigerator's energy rating and a washing machine's energy rating mean roughly the same thing regardless of which manufacturer built them, because both are tested against a shared norm. Industrial robots have no equivalent. Each manufacturer tests and reports power figures under its own conditions. Benchmark numbers published by different OEMs cannot be directly compared today, and any cross-vendor table assembled from datasheet values is comparing measurements that were never designed to line up with each other.
That gap is closing. ABB Robotics is leading the development of the first global ISO Technical Specification for measuring industrial robot energy consumption and efficiency, working alongside experts from 11 other countries and the Swedish Institute for Standards, with completion due by August 2026. The six-class load-capacity taxonomy established by the 2025 scoping review, spanning 0 to 250 kg in 50 kg increments plus a class above 250 kg, provides the categorical scaffolding that specification is expected to build on, aligning academic research classification with the emerging regulatory structure. ISO 10218-2:2025, covering safety requirements for industrial robot applications and robot cells, was published in 2025 and already establishes the cell-level regulatory context in which energy benchmarking will eventually have to operate, a sign that robot cell standards are evolving on multiple fronts at once.
Until the energy specification is finalized, if you're comparing robots across vendors, ask for the test conditions behind any published power figure, and treat cross-vendor comparisons as directional guidance.
Building a working benchmark process given today's data gaps
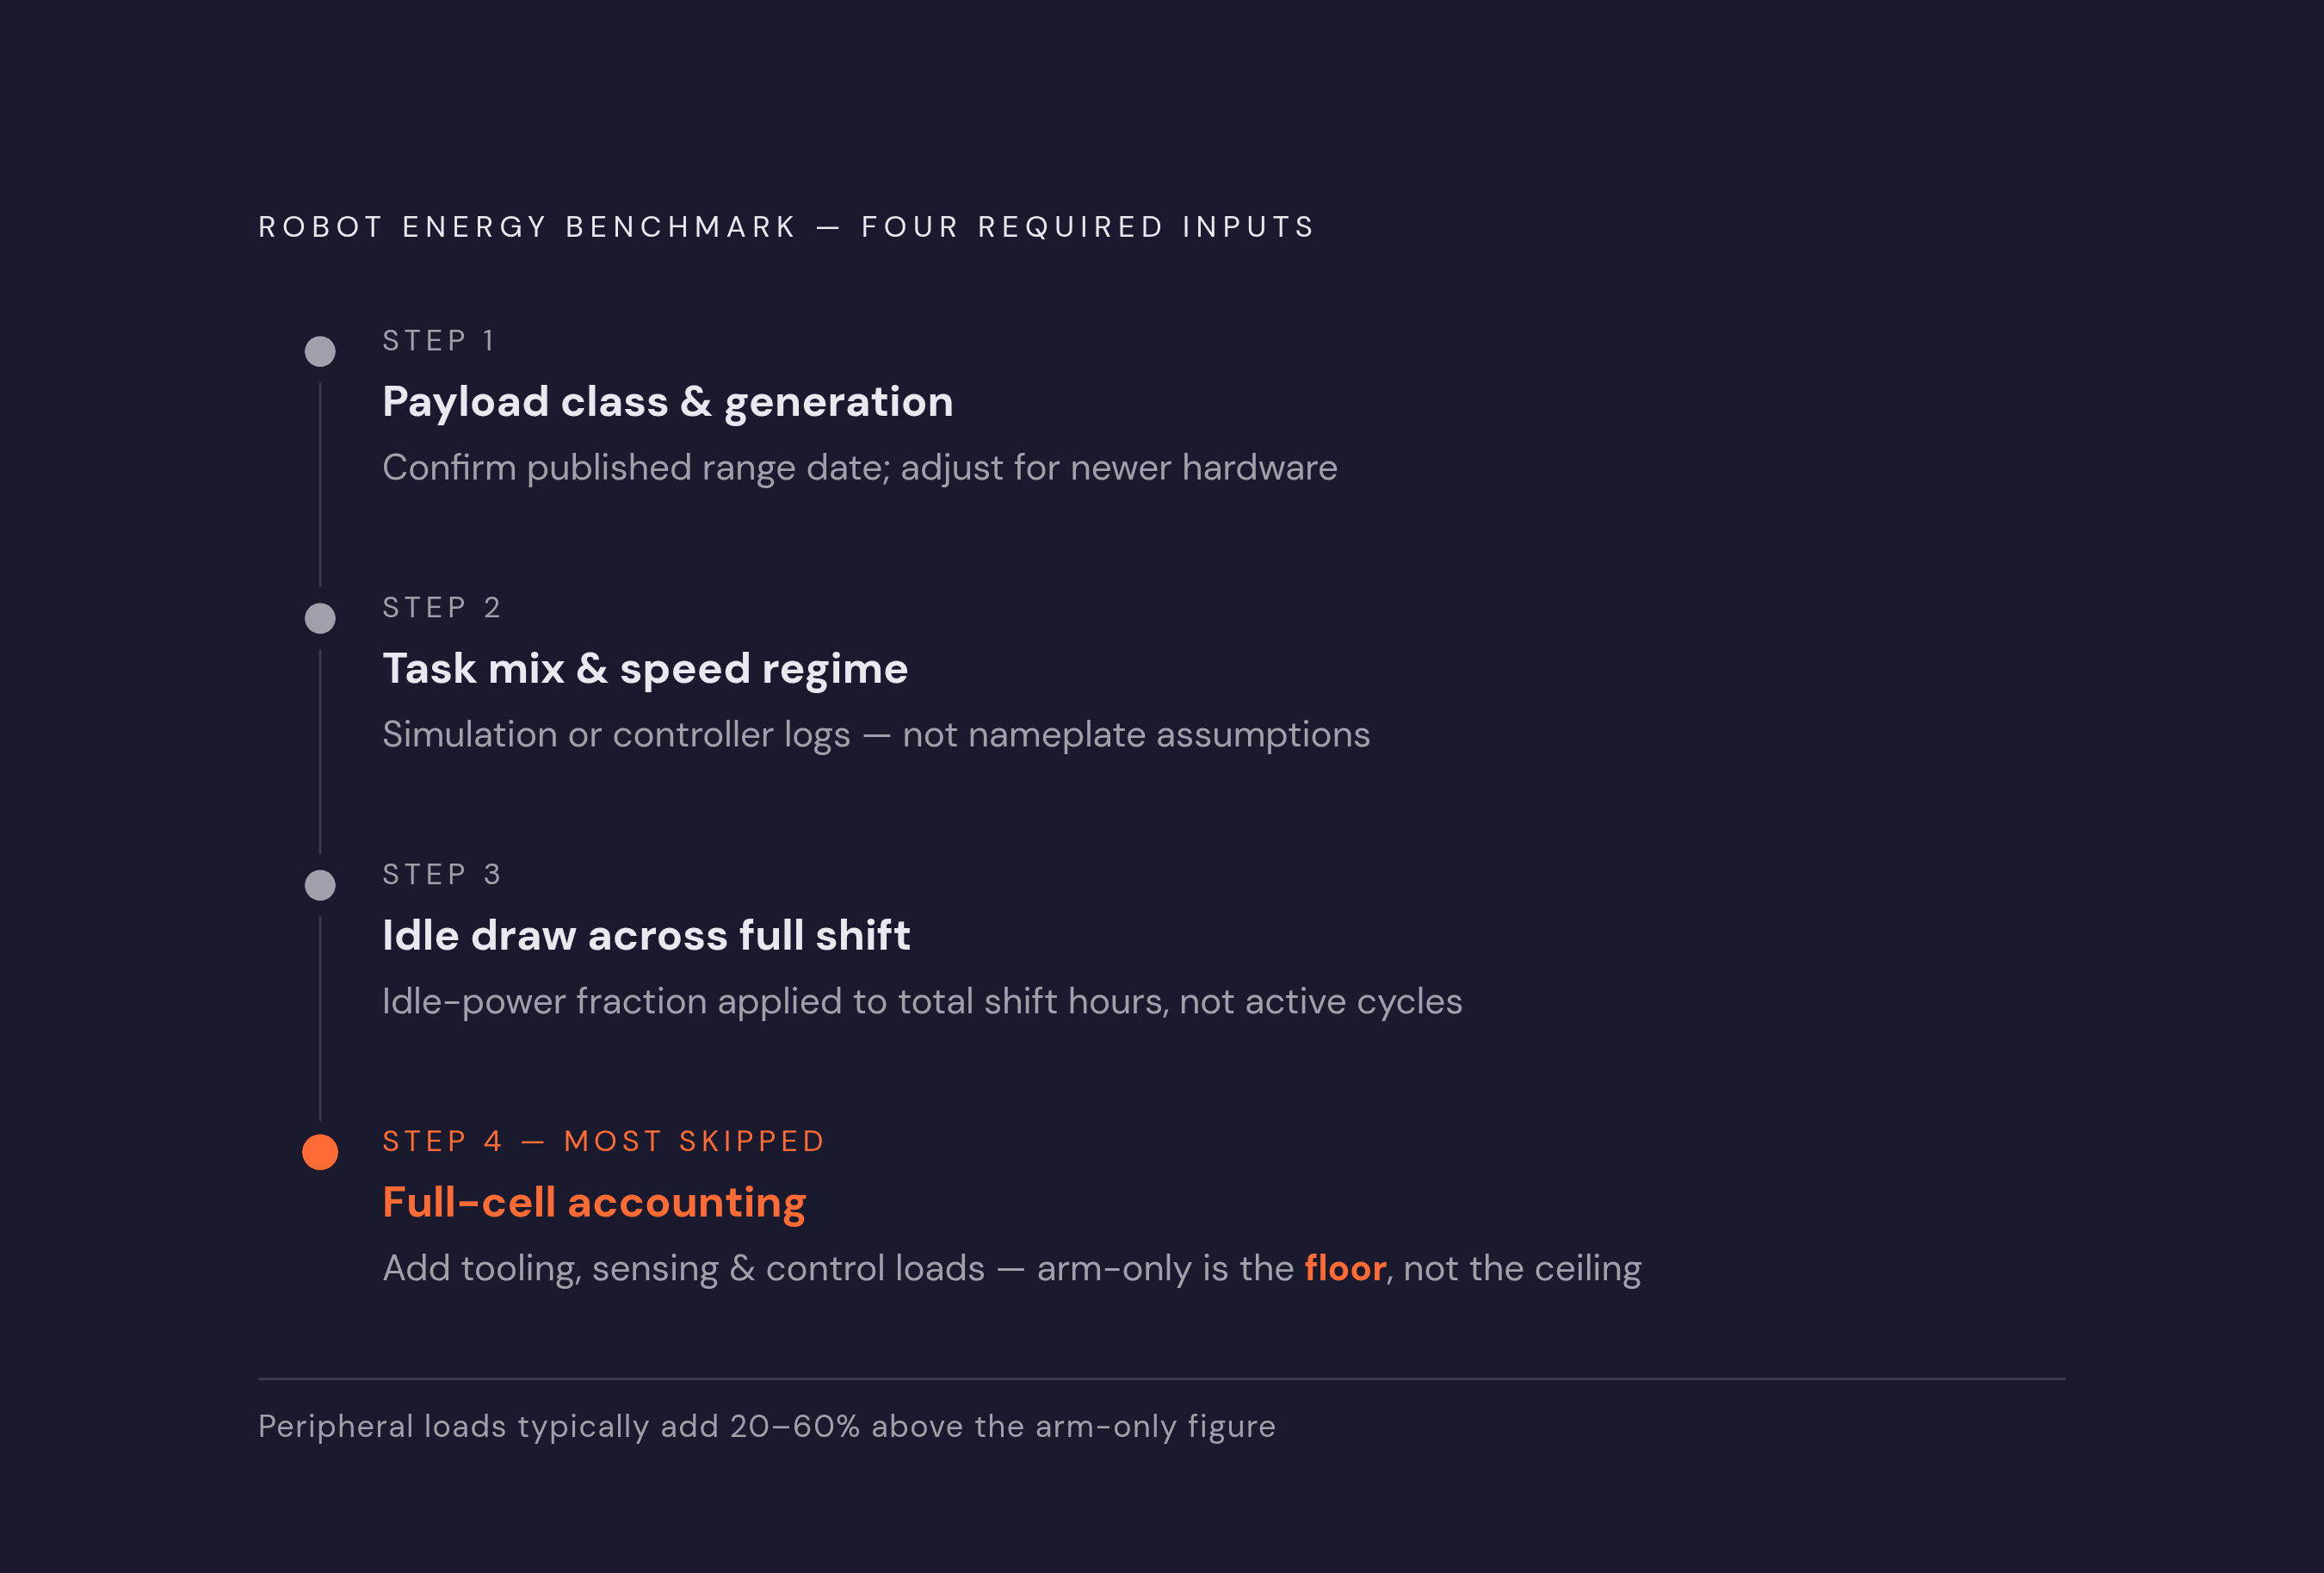
Five problems documented throughout this article, the real gradient across payload tiers, the large variance within each tier, the gap between arm-only and full-cell accounting, the hardware-generation effect, and the absence of a cross-vendor standard, together mean that a sound benchmark cannot be read off a single datasheet number. Building one requires layering four inputs in sequence.
The first step anchors the estimate to payload class and generation: select the published power range for the relevant class, confirm the date that figure was produced, and adjust directionally if the robot under consideration is more than a few years newer than the reference benchmark. The second step characterizes actual task mix and speed regime: you use simulation or controller-level logging to find out what fraction of operating time a robot spends at each speed and load level, rather than assuming nameplate payload equals typical operating load. The third step accounts for idle draw by measuring or estimating the share of shift time a robot spends in standby and applying that idle-power fraction across total shift hours, not just active-cycle hours. The fourth step expands the accounting boundary from the arm to the full cell, adding peripheral loads from tooling, sensing, and control hardware as application-specific additions on top of the arm-only figure, which should be treated as a floor.
Several tools support this process directly. The open-source EcBot MATLAB library lets you model energy consumption for manipulators from data, and it can automatically generate and validate energy-consumption models across different robot architectures. Data-driven IoT benchmarking frameworks let you model cell-level energy from operational sensor data, closing the distance between a datasheet estimate and what a cell actually consumes on the floor.
Once the ISO Technical Specification due in August 2026 is finalized, the first step in this process gets a lot more reliable, because cross-vendor power figures will finally be measured against a shared protocol. Until that specification lands, the four-step process stands as the practical alternative, and building the habit of measuring this way now means the transition to a standardized benchmark will require adjustment rather than a complete rebuild of how a fleet's energy costs get calculated.
Sources
- Energy consumption modeling based on operation mechanisms of industrial robots
Provided the scoping review data on power consumption ranges across payload tiers, the six-class load-capacity taxonomy, and specific robot model peak draw figures cited throughout the article.
- EcBot: Data-Driven Energy Consumption Open-Source MATLAB Library for Manipulators
Introduced the open-source EcBot MATLAB library for modeling energy consumption across robot architectures, cited as a practical tool in the benchmarking process section.
- Energy Optimization of Robotic Cells
Provided energy optimization research covering trajectory planning, layout design, and specific robot case results including the ABB IRB 6740 and KUKA KR 210-2 savings figures.
- Data-Driven Energy Modeling of Industrial IoT Systems: A Benchmarking Approach
Provided the data-driven IoT benchmarking framework for modeling cell-level energy from operational sensor data, cited as a tool to close the gap between datasheet estimates and actual floor consumption.
- ISO 10218-2:2025—Industrial Robot Applications - The ANSI Blog
Provided details on ISO 10218-2:2025 and context for the evolving cell-level regulatory framework in which energy benchmarking will operate.